In this artcle
Chatbot Analytics
Shows the performance of chatbots with visitors.
This dashboard provides information that helps you take informed decisions on the performance of the chatbot and define action items to improve them.
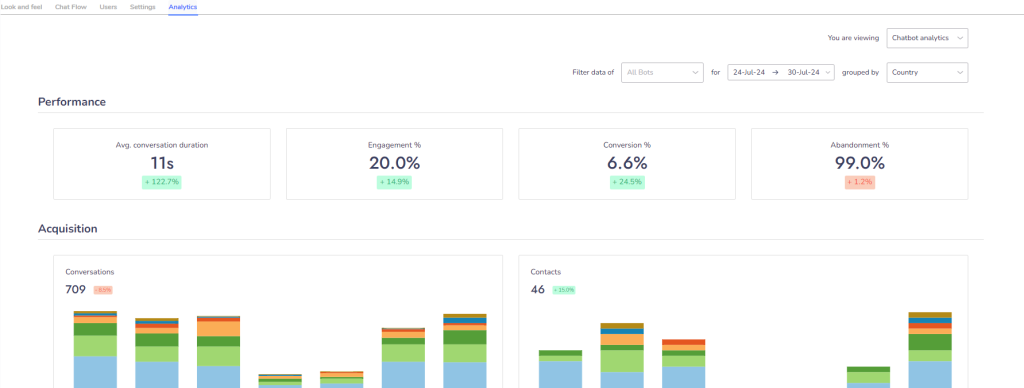
All the KPIs on this dashboard are grouped in 3 sections:
- Performance – Impact of the chatbots
- Acquisition – Volumes handled by the chatbots
- Engagement – Visitor engagement with the chatbots
Performance KPIs
| KPI | Description |
|---|---|
| Average conversation duration | The average amount of time spent by visitors speaking with the chatbots. |
| Engagement % | Percentage of conversations created after the chat widget was displayed to visitors on the webpage. For example, if your website had 100 visitors and there were 10 chats started with your chatbots, then your engagement rate is 10%. |
| Conversion % | Percentage of contacts generated from the visitors that have conversed with the chatbots. For example, if your chatbot handled 100 chats and you received 10 contacts from them, then your conversion rate is 10%. |
| Abandonment % | Percentage of conversations which were abandoned by the visitors and not completed. |
Acquisition KPIs
| KPI | Description |
|---|---|
| Conversations | Shows the total number of chats handled by the chatbots. |
| Contacts | Shows the total number of contacts generated by the chatbots. A contact is said to be generated, if the chatbot has collected the visitor’s phone or email. |
| Acquisitions by | Showcases a tabular view of # of chats and contacts grouped by a property. Properties offered are, – Country – City – State – Webpage – Referral – UTM source – UTM medium – UTM campaign |
| Visitors | Total number of visitors that interacted with the chatbots. |
On the tabular view you can mark the rows which are important for you by starring it. Doing this will shows these rows in the starred view.
Engagement KPIs
| KPI | Description |
|---|---|
| Heatmap of day and time | Highlights the time during which visitors most engage with the chatbots the most during the week. You can hover on each tile to see the actual value. |
| Flow engagement | Shows the number of times a conversation has reached a certain point in the chatbot flow. Each action block in your chatbot flow is given a unique name. Whenever during a chat a visitor crosses that action block, we increment the count of that action block by 1. This is similar to firing events on Google Analytics when an action is performed. Each action block also has a Exit % which determines how many chats were ended by the visitor because they did not move beyond the action block. This helps you identify where the drop-offs happening so you can tweak the content or the flow. |
![]() Note:
Note:
– All the KPIs on this dashboard can be exported into a CSV file.
– All KPIs showcase the data based on the account timezone.